5 Proven Techniques for Awesome Power BI Data Transformation

In this article I will introduce you to 5 Proven Awesome Power BI Data Transformation Techniques to help you master Power BI
5 Proven Tips for Connecting to Data Sources in Power BI

Introduction Connecting to data sources in Power BI is crucial for creating insightful and dynamic reports. With the right connections, you can access and analyse data from various sources to drive informed business decisions. This article provides essential tips for effortlessly connecting to data sources in Power BI, ensuring a seamless and efficient process. Understanding […]
Power BI Desktop vs. Service: 5 Great Key Points

In this post we will compare Power BI Desktop to the Power BI service.
5 Reasons to Use Power BI: Introduction and Benefits Explained

Understanding Power BI Power BI is a comprehensive business analytics tool developed by Microsoft, designed to transform raw data into meaningful insights through interactive visualisations and detailed reports. It serves as a bridge between data and decision-making, enabling users to analyse data from multiple sources in a cohesive and visually engaging manner. The primary components […]
Data Visualisation Made Easy: Power BI vs Tableau for You

Picking the perfect tool to turn your data into cool charts and graphs can be tough, especially when looking at Power BI vs Tableau. Even though both are strong options, they each have their own specialties. This article will break down those differences in a way that’s easy to understand, so you can pick the […]
The Ultimate Guide to Beautiful Power BI Dashboard Design
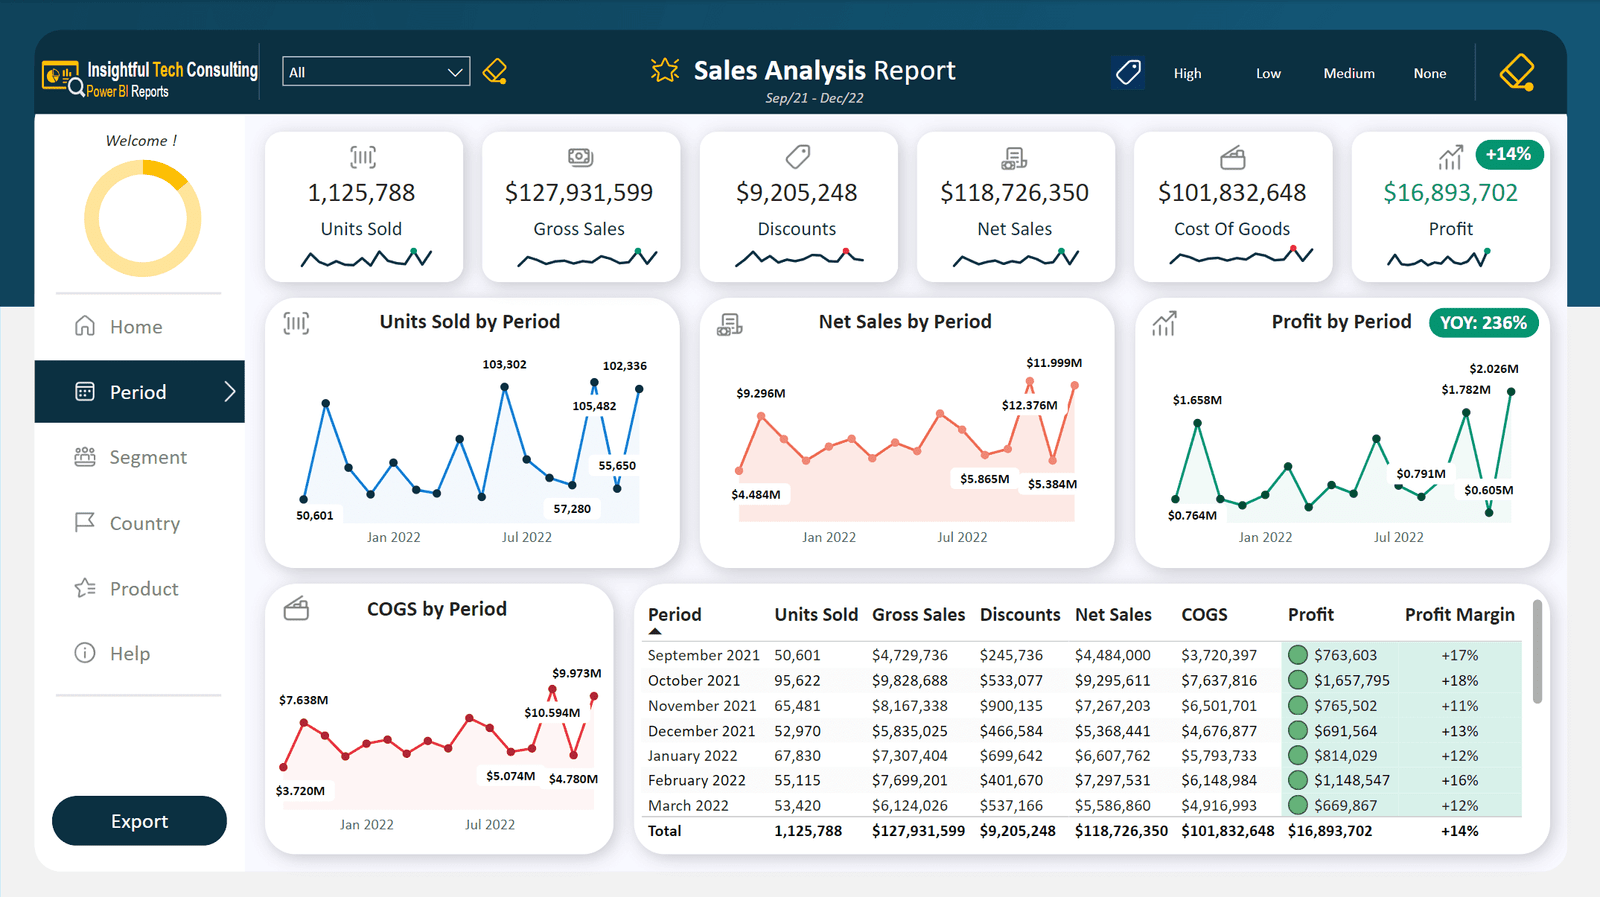
Unlock the potential of your data with beautiful Power BI dashboards that impress and inform. Creating visually appealing and highly functional dashboards in Power BI is a skill every data professional should master. This ultimate guide will walk you through the step-by-step process of creating stunning dashboards that not only look great but also deliver […]
10 Proven Data Visualisation Tips to Become a Pro

In the world of data analysis, effective visualisation is key to making data insights accessible and impactful.