Data Visualisation Made Easy: Power BI vs Tableau for You

Picking the perfect tool to turn your data into cool charts and graphs can be tough, especially when looking at Power BI vs Tableau. Even though both are strong options, they each have their own specialties. This article will break down those differences in a way that’s easy to understand, so you can pick the […]
Empower Your Data Stories: Python Visualisation Made Easy

Any Python developer needs to know data analysis well. You might look at sales data, scientific research, or social media trends. Python has powerful tools to help you see and understand your data. In this step-by-step guide, we’ll show you how to do data analysis with Python. We’ll focus on Python visualisation techniques using libraries […]
The Ultimate Guide to Beautiful Power BI Dashboard Design
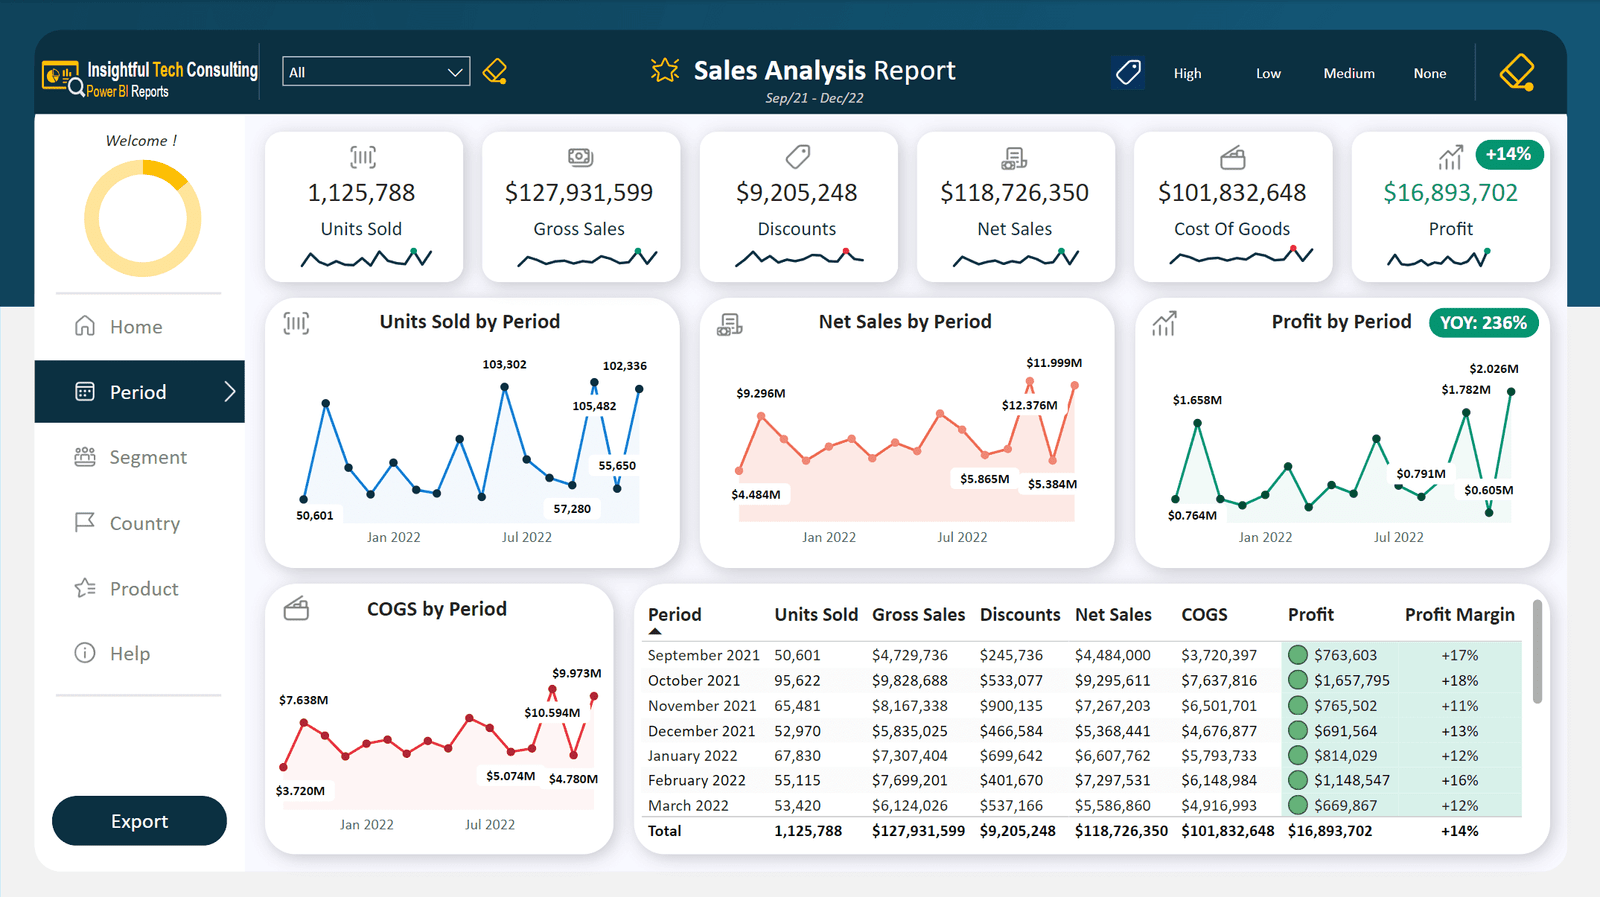
Unlock the potential of your data with beautiful Power BI dashboards that impress and inform. Creating visually appealing and highly functional dashboards in Power BI is a skill every data professional should master. This ultimate guide will walk you through the step-by-step process of creating stunning dashboards that not only look great but also deliver […]
Master Data Analysis With These 10 Best Powerful Python Libraries

In today’s data-driven world, mastering Python libraries for data analysis is akin to wielding a powerful toolset for unlocking valuable insights.
10 Proven Data Visualisation Tips to Become a Pro

In the world of data analysis, effective visualisation is key to making data insights accessible and impactful.