Any Python developer needs to know data analysis well. You might look at sales data, scientific research, or social media trends. Python has powerful tools to help you see and understand your data. In this step-by-step guide, we’ll show you how to do data analysis with Python. We’ll focus on Python visualisation techniques using libraries like Seaborn and Visualiser Python.
Introduction
Has the amount of data on a spreadsheet ever overwhelmed you? Although data might intimidate. With the correct tools and meaningful visualisations, you can make data understandable. The programming language Python has become a favourite among developers. It is flexible and developers use it for data visualisation and analysis. This guide will walk you through each stage of the procedure. I will use practical examples and simple explanations.
Getting Started with Python Visualisation
Prior to starting data analysis, it is important to establish your environment. Here’s what you’ll need:
- Python: Make sure you have Python installed on your computer. You can download it from the official Python website.
- Jupyter Notebook: This is an excellent tool for data analysis and visualisation. Install it using pip:
pip install notebook.
Another way to get Jupyter Notebook is by installing Anaconda. Which has a large range of Python libraries. You can install them using a graphical environment. Anaconda has a host of other tools you can download and install. I use Anaconda as it is convenient. Download Anaconda from the official download page here. - Libraries: We’ll use several Python libraries for visualisation, including Matplotlib, Seaborn, and Visualiser Python. Install them using pip:
pip install matplotlib seaborn yellowbrick
Loading Your Data
To analyse data, you need to load it into your Python environment. For this example, we’ll use a sample dataset from Seaborn:
import seaborn as sns
import pandas as pd

# Load the example dataset
data = sns.load_dataset('tips')
print(data.head())
This code loads a dataset about restaurant tips, which we’ll use for our analysis.
Understanding Your Data
Before creating visualisations, it’s essential to understand your data. Look at the first few rows, check for missing values, and get a summary of your data:
# Summary of the data
print(data.describe())

# Check for missing values
print(data.isnull().sum())
This helps you identify any data cleaning steps you might need to take.
Creating Basic Plots with Matplotlib
Matplotlib is a foundational library. Developers use it to create static visualisations in Python. Here’s how to create a simple plot:
import matplotlib.pyplot as plt

# Plot total bill against tip
plt.scatter(data['total_bill'], data['tip'])
plt.xlabel('Total Bill')
plt.ylabel('Tip')
plt.title('Total Bill vs. Tip')
plt.show()
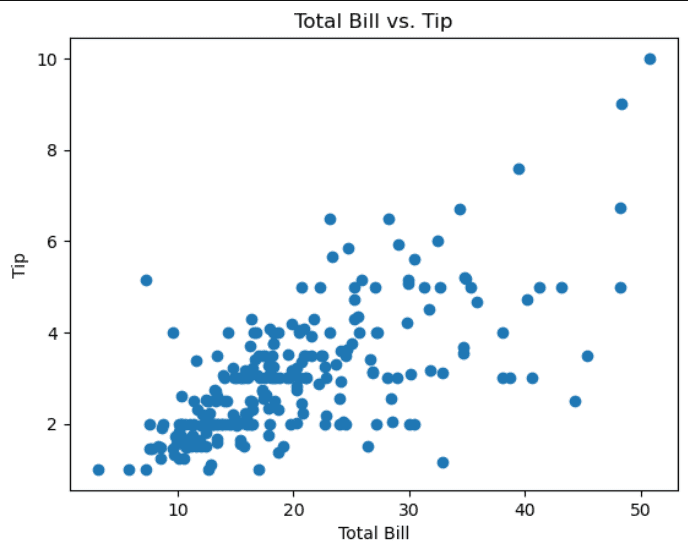
This scatter plot shows the relationship between the total bill and the tip amount.
Enhancing Visuals with Seaborn
Seaborn builds on top of Matplotlib. It provides a higher-level interface for creating attractive and informative statistical graphics. Let’s enhance our previous plot:
# Enhanced scatter plot with Seaborn
sns.scatterplot(x='total_bill', y='tip', data=data)
plt.xlabel('Total Bill')
plt.ylabel('Tip')
plt.title('Total Bill vs. Tip with Seaborn')
plt.show()

Seaborn makes it easy to create complex visualisations with just a few lines of code.
Advanced Visualisations with Visualiser Python
Visualiser Python, specifically the Yellowbrick library, provides visual tools for diagnostic machine learning. Here’s an example of using Yellowbrick for a simple regression analysis:
from yellowbrick.regressor import ResidualsPlot
from sklearn.model_selection import train_test_split
from sklearn.linear_model import LinearRegression

# Prepare the data
X = data[['total_bill']]
y = data['tip']
X_train, X_test, y_train, y_test = train_test_split(X, y, test_size=0.2, random_state=42)

# Create the model
model = LinearRegression()
model.fit(X_train, y_train)

# Visualise the residuals
visualiser = ResidualsPlot(model)
visualiser.fit(X_train, y_train)
visualiser.score(X_test, y_test)
visualiser.show()

This plot helps you understand the performance of your regression model by visualising the residuals.
Real-Life Example: Analysing Sales Data
Let’s say you have a dataset of sales data and want to understand trends and patterns. Here’s how you can do it:
- Load the data:
sales_data = pd.read_csv('sales_data.csv') print(sales_data.head()) - Check for missing values and clean the data:
sales_data.dropna(inplace=True) - Visualise sales trends over time:
plt.plot(sales_data['date'], sales_data['sales']) plt.xlabel('Date') plt.ylabel('Sales') plt.title('Sales Trends Over Time') plt.show()
Conclusion
Data analysis with Python is a powerful way to turn raw data into meaningful insights. Libraries like Matplotlib, Seaborn, and Visualiser Python. You can use them to create stunning visualisations. These visualisations will help you understand and communicate your data better. Begin with easy graphs and try harder ones as you get better.
Are you ready to look deeper into Python visualisation? Explore more advanced techniques and tools to enhance your data analysis skills. Happy coding!
Frequently Asked Questions
What is Python Visualisation?
Python visualisation refers to the process of creating graphical representations of data. You use Python libraries like Matplotlib, Seaborn, and Visualiser Python. These visualisations help in understanding and communicating data insights effectively.
Why use Seaborn Python for data visualisation?
Seaborn builds on top of Matplotlib and offers a higher-level interface for creating attractive and informative statistical graphics. It simplifies creating complex visualisations with fewer lines of code.
How can Visualiser Python help in data analysis?
Visualiser Python, such as the Yellowbrick library, offers visual diagnostic tools for machine learning models. It helps in understanding model performance, tuning hyperparameters, and diagnosing potential issues in your models.
What are the best practices for data analysis with Python?
Best practices include understanding your data before analysis, cleaning and preprocessing data, using appropriate visualisation techniques, and validating your results. It’s also important to document your analysis process and findings.
Can I perform real-time data visualisation with Python?
Yes, Python can handle real-time data visualisation using libraries like Bokeh and Plotly, which provide interactive and dynamic plots that can update in real-time as data changes.
What is the role of Jupyter Notebook in data analysis?
Jupyter Notebook is a powerful tool for interactive computing. It allows you to create and share documents that contain live code, equations, visualisations, and narrative text, making it ideal for data analysis and visualisation.
Contact me for further information. And look at my other python articles here.